Infographics

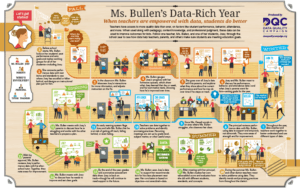
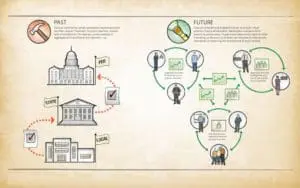
From sophisticated systems to individual use, data is critically important to ensuring that data works for everyone navigating their education and workforce journeys. Throughout the years, DQC has released over a dozen infographics that illustrate what it looks like when individuals have the data and the tools they need to make informed decisions.

Mr. Maya’s Data-Rich Year

See how, in the course of one year, Mr. Maya leverages data to enable teachers and students to set and meet their goals.
What is student data? Our infographic highlights he data is used to form a full picture of student learning.
This tool summarizes some of the main provisions of FERPA and identifies when students’ personally identifiable information may be securely shared under the law.
See how student data—from schools to the US Department of Education—is and is not accessed and used.
Follow a teacher and student through the school year to see how data help teachers, parents, and others make sure students are meeting education goals.

Our Work

We envision a world where data is used to drive systemic change, economic mobility, and student success.

About

We advocate to change the role of data to ensure that data works for everyone navigating their education and workforce journeys.