
Lately, I’ve seen yard signs in my neighborhood that read, “What a year this week has been.” It seems like no truer words have been spoken. The disruption in education caused by the global health emergency has ripple effects. One that is glaring to those of us in the education field is the lack of assessment data from last spring. That missing data also means that state report cards will have some gaping holes in them as states work to release information about the 2019-2020 school year. But the lack of student performance data does not mean that student report cards should remain blank or without use. Report cards are still a state’s most public-facing resource for parents and communities, and even without performance data, there is a lot states can communicate about schools.
As state leaders look to update their report cards for the 2019-2020 school year, and as we begin our review of these report cards for the next Show Me the Data report, we have the following advice for states:
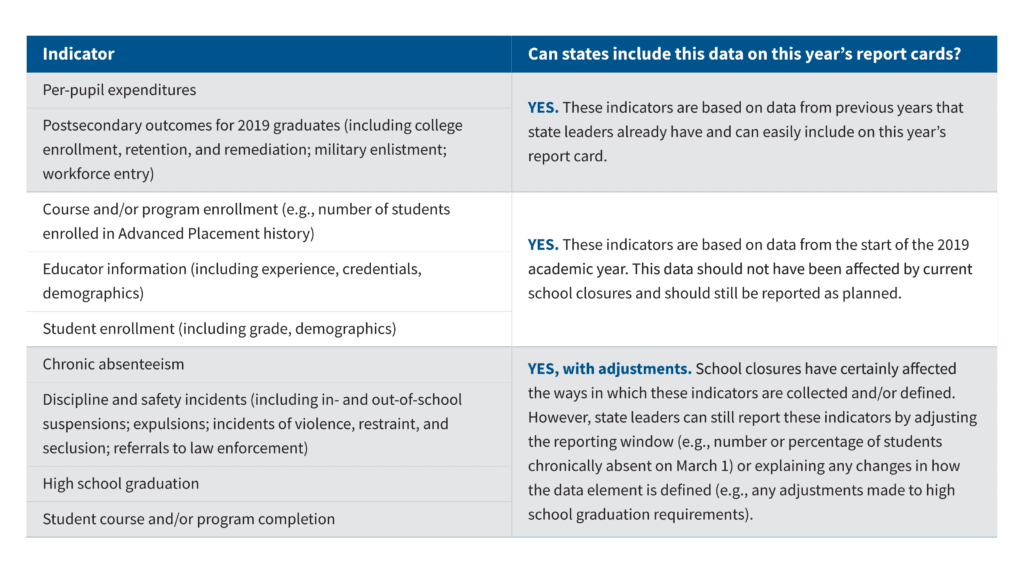
1. Everything that isn’t tied to performance data should still be on state report cards.
As DQC discussed in our brief, Promoting Transparency and Maintaining Public Trust: Report Cards and the COVID-19 Crisis, there is plenty of data that states can update on their report cards as usual. Data like per-pupil expenditure data and postsecondary outcomes data are based on information from previous years and can be reported with no changes, though states must include language that provides context for this information. Similarly, data like course enrollment, student enrollment and educator information are all based on information from the beginning of the 2019-2020 school year and can be reported as planned.
2. Provide as much context as possible.
For data that can’t be reported as usual, meaningful explanations will provide context that helps parents and communities understand the data on state report cards. This content should appear on, near or adjacent to the relevant data on report cards, allowing individuals to understand the information in context without needing to search the entire website to locate it. We have been advocating for years in our Show Me the Data reports that states must be mindful of the language included on report cards, making sure that it provides helpful context to the data that is there. Dare I say it? Now, it is more important than ever.
3. Clearly communicate all data in ways that ensures the public can understand it.
This one isn’t new and isn’t unique to reporting data during COVID-19 school closures. Communication is one of the most important parts of ensuring the report cards are useful and used—but too many states do not ensure that the public can understand what is on their report cards. Our 2020 Show Me the Data analysis found the following:
- Only 25 states provide the option to translate their report card into a language other than English. Translating report cards into the languages spoken in a state ensures that all families can understand school quality and student progress. While Google Translate can serve as a place to start, it alone does not meet translation needs.
- Even though report cards have become easier to find, the language on them is not friendly for the average user. Information that is overly complicated or filled with education jargon doesn’t help anyone understand school quality and student progress. Complicated language is also harder to translate into other languages. DQC has reviewed the reading level of states’ report cards using hemingwayapp.com, a free online tool, for four years, and yet we find that the language on report cards is often at a college reading level, rather than a much friendlier 8th grade or below.
4. Don’t zero out report cards.
Last month, Tennessee received criticism for removing data from its report card related to academics, attendance, finances, and staffing. Removing years of data from any report card fails to serve communities and leaves stakeholders wondering, why? States should continue to make past years’ data available. What will make the difference is how states message this information and use language to help the public understand why that data is missing and what it means.
5. Seek out ways to clearly share different data.
School looks different this year, and so too should the things states put front and center in their efforts to communicate about districts and schools. States should prioritize including data on attendance and chronic absence, and consider sharing explanations for why students didn’t show up to school this year. For example, we’ve seen that Kentucky includes “access to technology” data on its report cards. Was enrollment down? Could the state not find thousands of students because those students couldn’t log on to school? States need to do their due diligence to figure this out—it’s not just about reporting this information, but building the muscle as a state to uncover what happened to students. This is information the public should have and states should include it on their report cards this year.
When we start reviewing report cards for all 50 states and DC for Show Me the Data 2021, we’ll also be looking for ways that states are using their report cards as communications tools more broadly. For example, in the spring, Texas added a “meal site locator” to their report card to help families get the support they needed. While they’ve since moved this feature to another page, resources like this can make a difference for how families and communities are kept informed.
The pandemic has underscored the need for these public-facing documents to provide as much information as possible to parents and communities. We’ll be focused on highlighting examples of how states are truly making them one stop shops that keep the public informed.